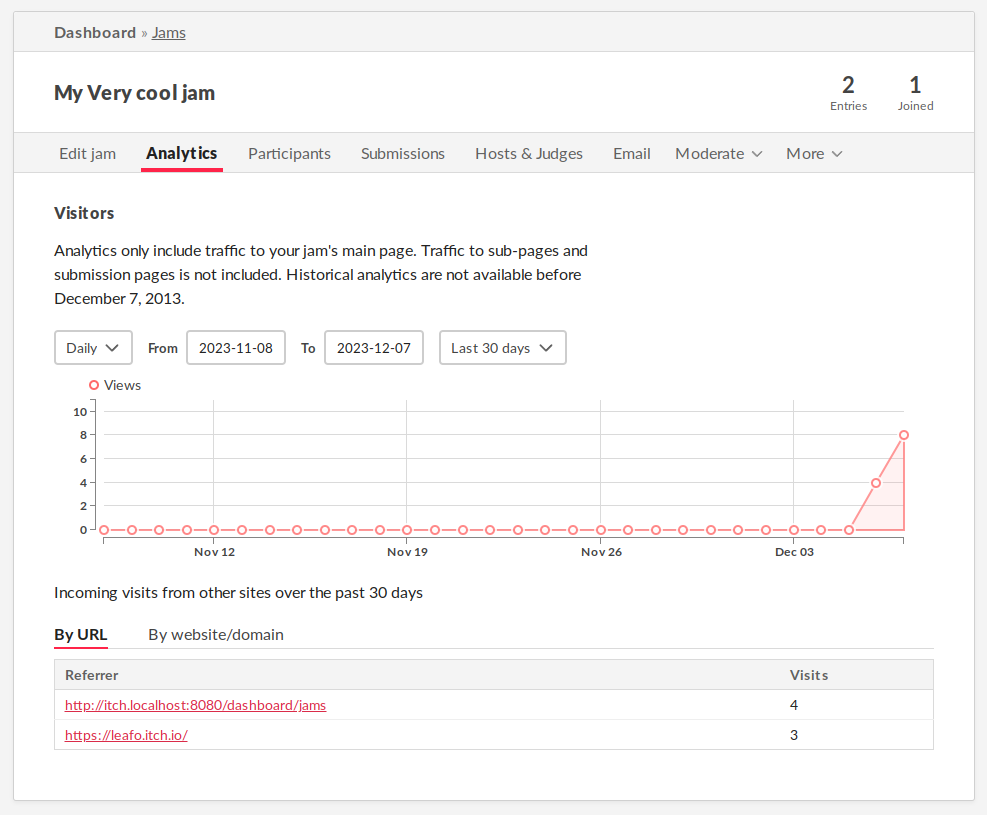
Jam hosts will now find a new tab on their jam edit tools: Analytics!
This tab collects information about visitors to your jam’s page, along with the referral information so you can get an idea of what websites are generating the most traffic for your jam.
Just like project analytics, you can graph data either weekly or daily, for any date range up to a year in length.
As this is a new analytics collection endpoint for us, data is only available from December 7, 2013 onward.

Please note that the referral data shown on the Analytics page may not fully represent the actual number of visits from different sites, browsers, and apps. Many platforms and technologies now employ measures that limit or omit the referral information for privacy and security reasons. Therefore, while useful, this data should be considered an estimation and may not comprehensively account for all sources of traffic.
Do you want to see more analytics for game jams? Tell us here and we’ll take it into consideration.

